AI-Driven Cost-Effective Scaling
📈
What is scaling & why is it a problem?
Tech jargon can be overwhelming. Let's use an analogy.
Context
McDonald's centrally supplies it's outlets 🍔
They need timely pre-ordering, distribution and delivery from the HQ to respective outlets to meet demand for burgers.

Problem 1
Demand varies by location and season 😕
Mumbai outsells Ahmednagar; Goa's sale varies drastically in holiday and off season.
This causes a distribution issue.

Problem 2
Supplies aren't always available 🫣
Vendors may not have potatoes to sell on days when fries are in demand, precise pre-ordering is necessary.
Shortages or wastages cause losses.

Solution
Scaling
McDonald's orders supplies in advance based on an expected gestation period and intelligent predictions of how demand would vary.

Breaking the analogy
An app (McDonalds) runs on multiple backend services (Outlets).
When many users access it concurrently (How many people walk in), instances (supplies) of these services (outlets) need to be scaled up or down to manage the requests and save costs respectively.
Furthermore, AWS cannot guarantee instance allocation on demand, pre-ordering is required. (You can't tell a farmer to grow potatoes for you to make fries today, you'll have to tell them in advance)
Business Problem
Unused infrastructure, costing millions of dollar. Less visibility, less accountability in service scaling.
Hypothesis
Enhancing control and visibility cuts scaling costs.

Stakeholders

Data Scientist
Offers a user concurrency prediction API

Watch Commander
Ensures the app is up and running, this is a rotating duty.

Service Owner
Responsible for scaling their own services
💡
Why was this happening?
5 Whys method with users to uncover underutilisation reasons.
#1
Why was the infrastructure usage unoptimized?
Stakeholders added buffers between data handoffs: Concurrency was offset by the data science, service reactions were offset by the service owner.
#2
Why were the stakeholders adding such huge buffers?
Service Owners: Uncertainty about service behaviour under traffic load. Data Science: Concurrency was buffered to offset increased marketing spends. This is valid.
#3
Why were the service owners uncertain about service behaviour?
Because of Ineffective load testing results.
#4
Why was load testing ineffective?
Because services were tested in isolation, this yielded results in requests per minute. The service owners were unaware of the impact of overall concurrency on their services.
#5
Why were service owners unaware of overall concurrency impact?
There was no time or convenient place to see the mapping of Concurrency and RPM. Also, low visibility took away any motivation to save costs.
Pain Points


🔧
Solution Overview
We created a solution to monitor concurrency, identify & fix under-scaled services, and enable confident mapping of Concurrency to RPM to Instances while retaining control.
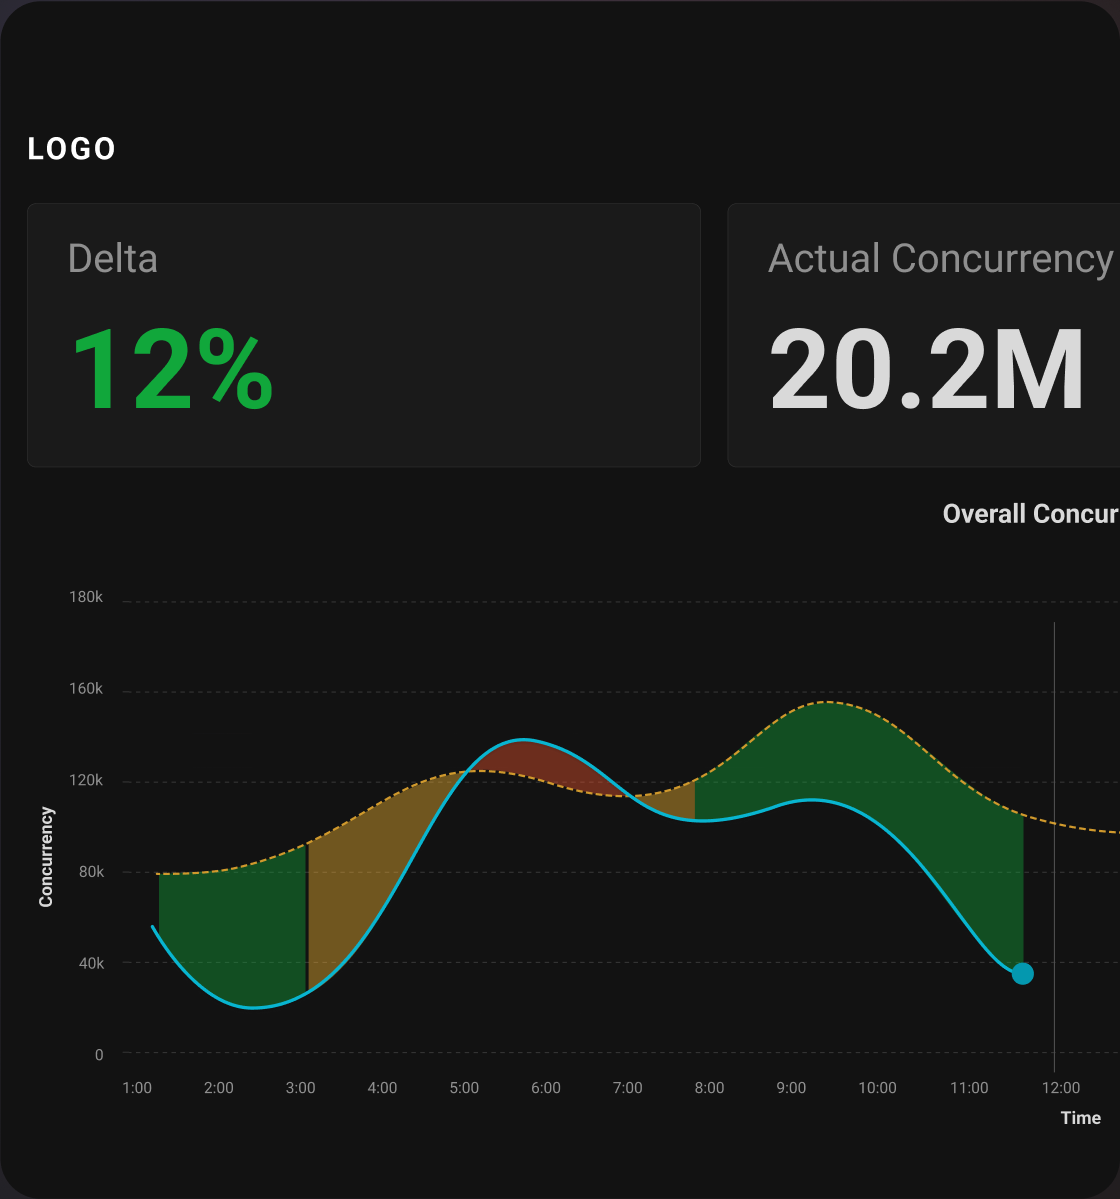
Product Area #1
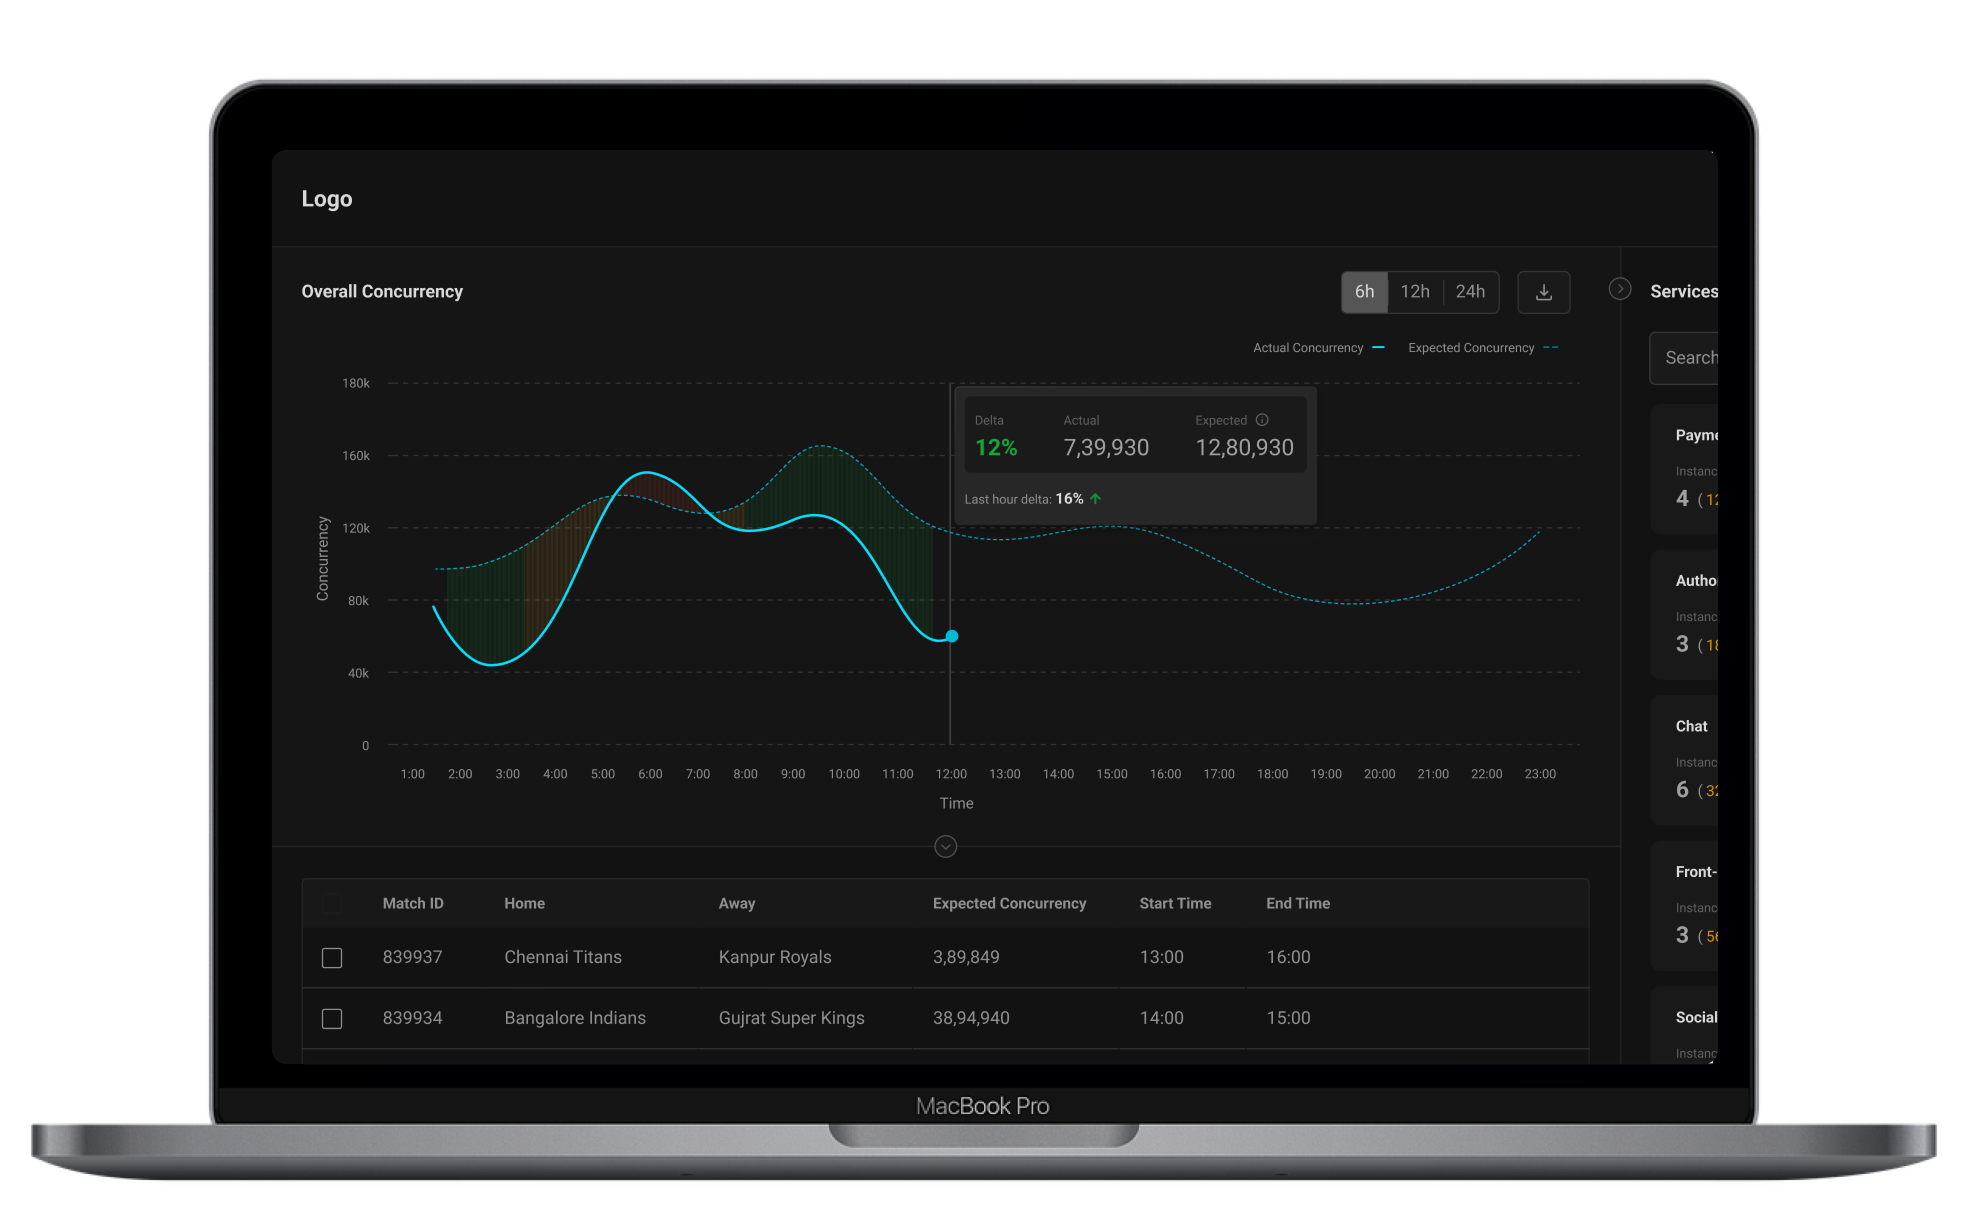
Home
This page is an aggregate view of how the product is scaling, helps the watch commander in monitoring overall concurrency.
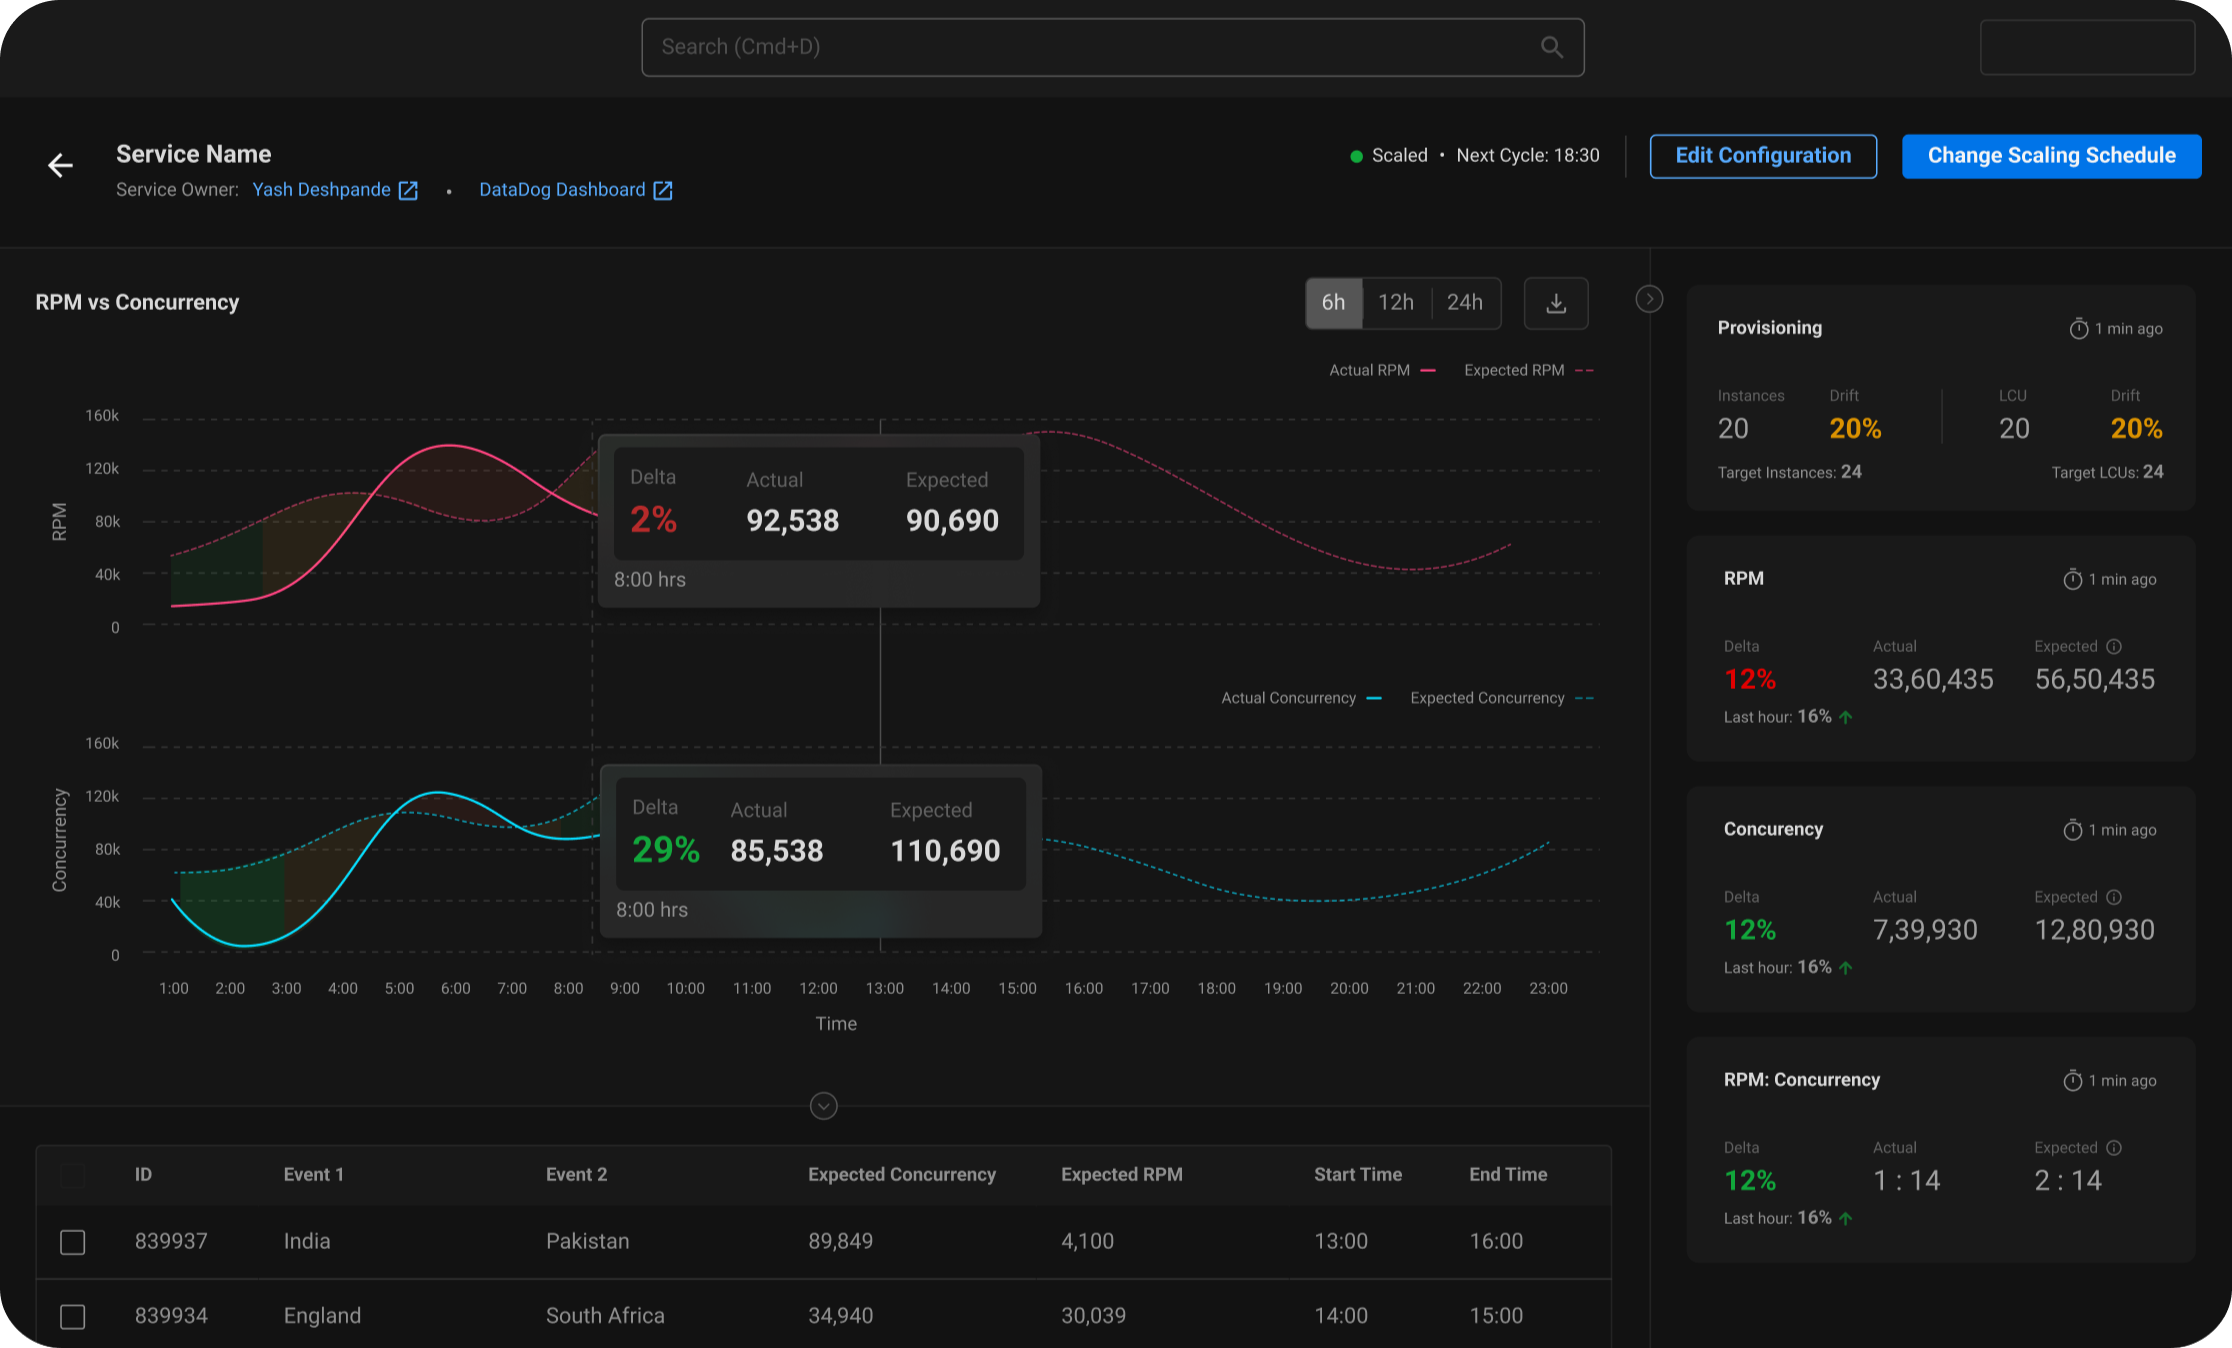
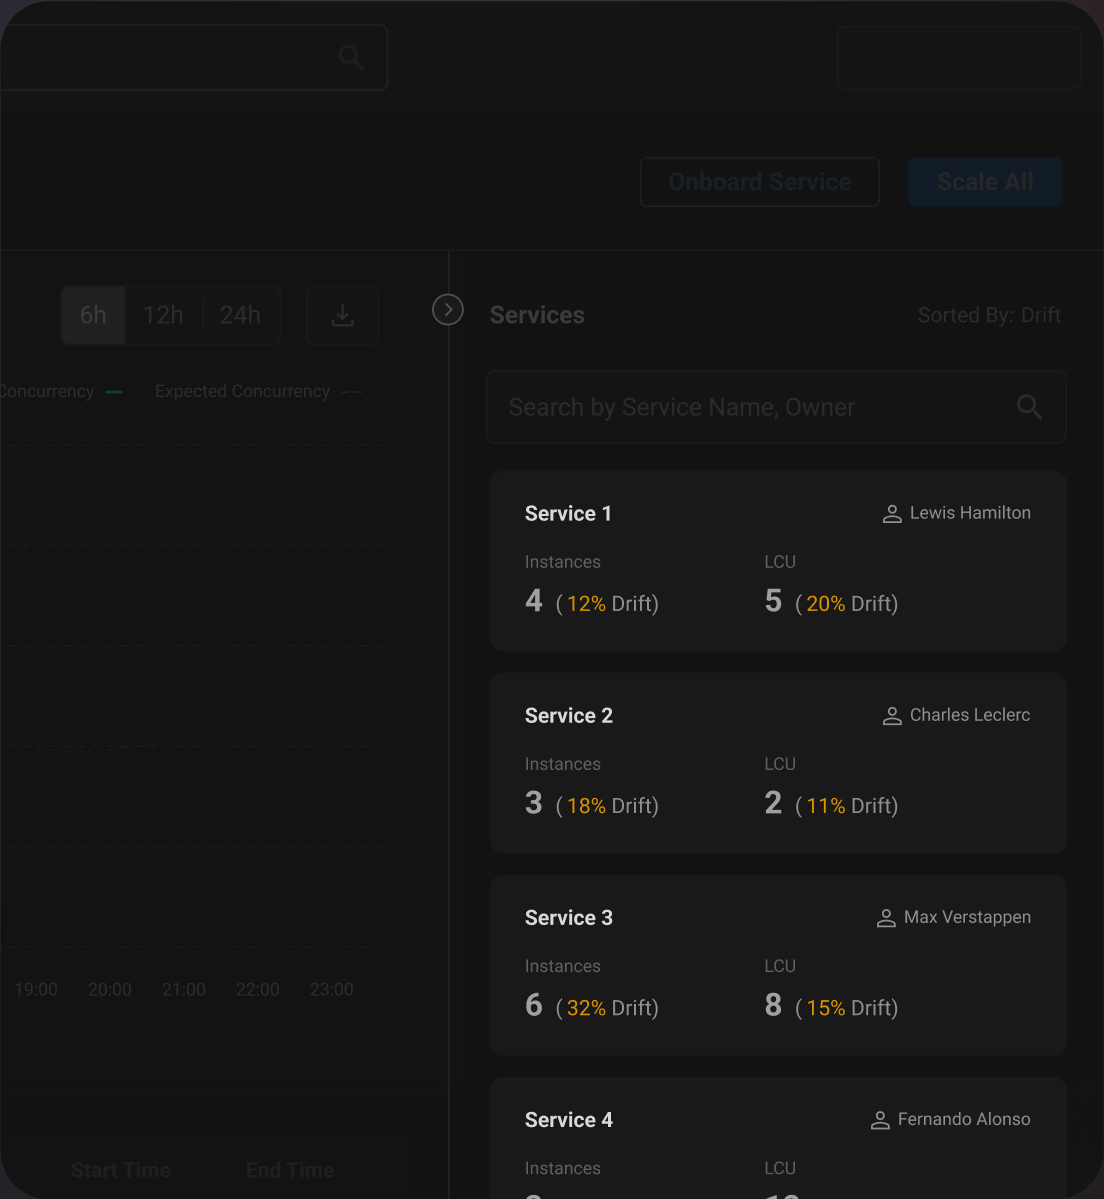
Product Area #2
Service Detail Page
This page is for the service owner to monitor their service and make necessary amendments.
👀
Solving for Visibility & Awareness
Building awareness about Concurrency, RPM and increased visibility amongst users and the organisation.
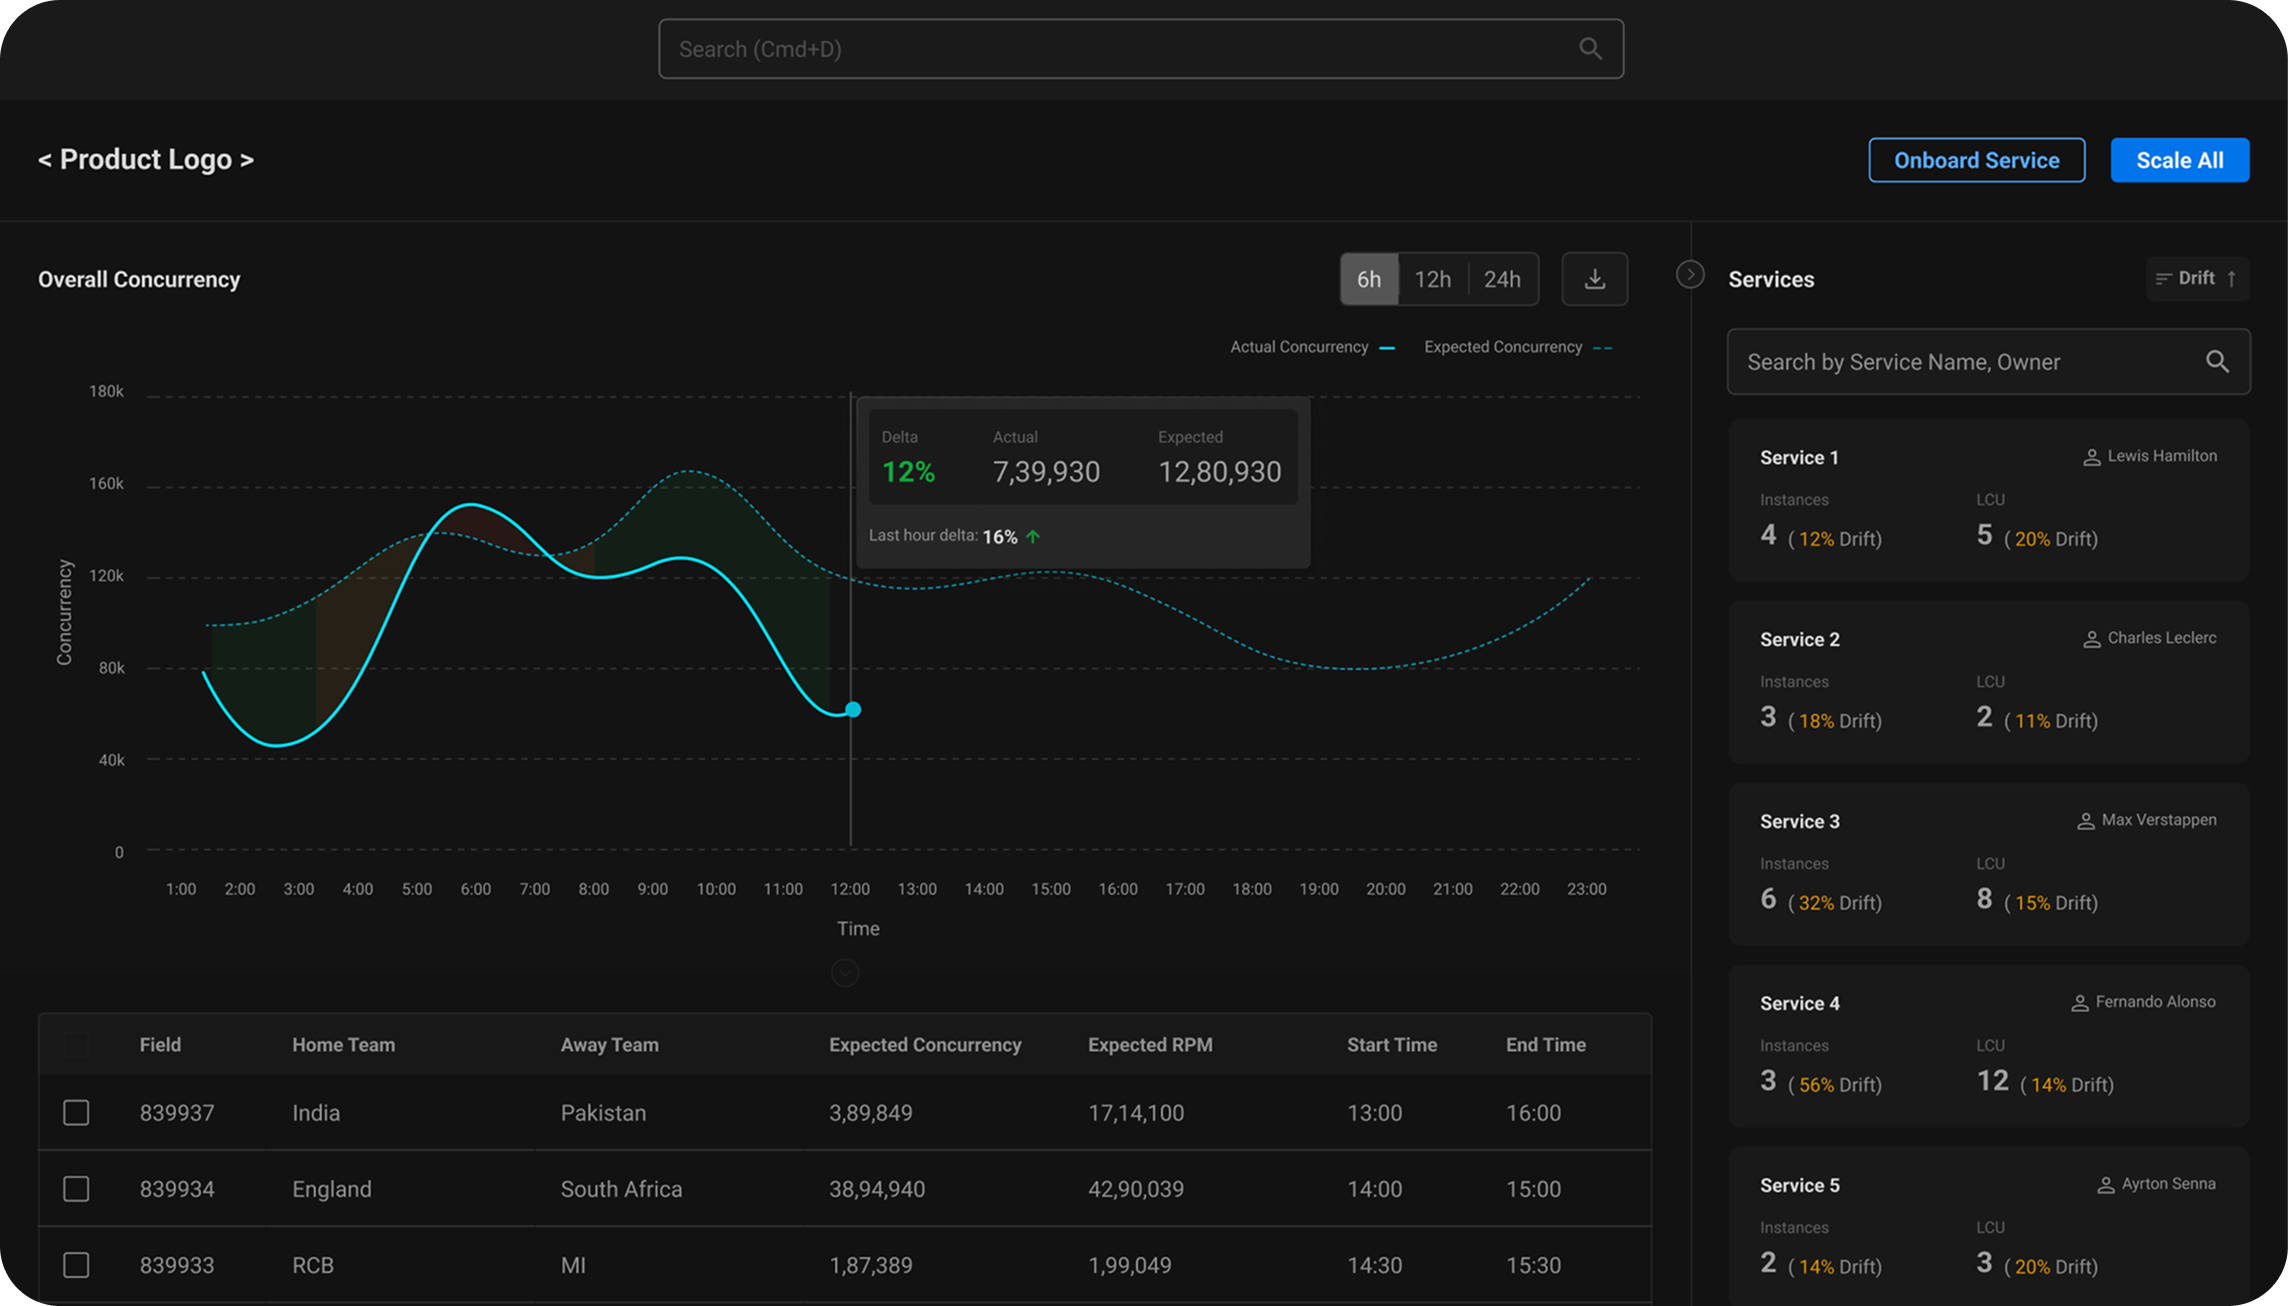
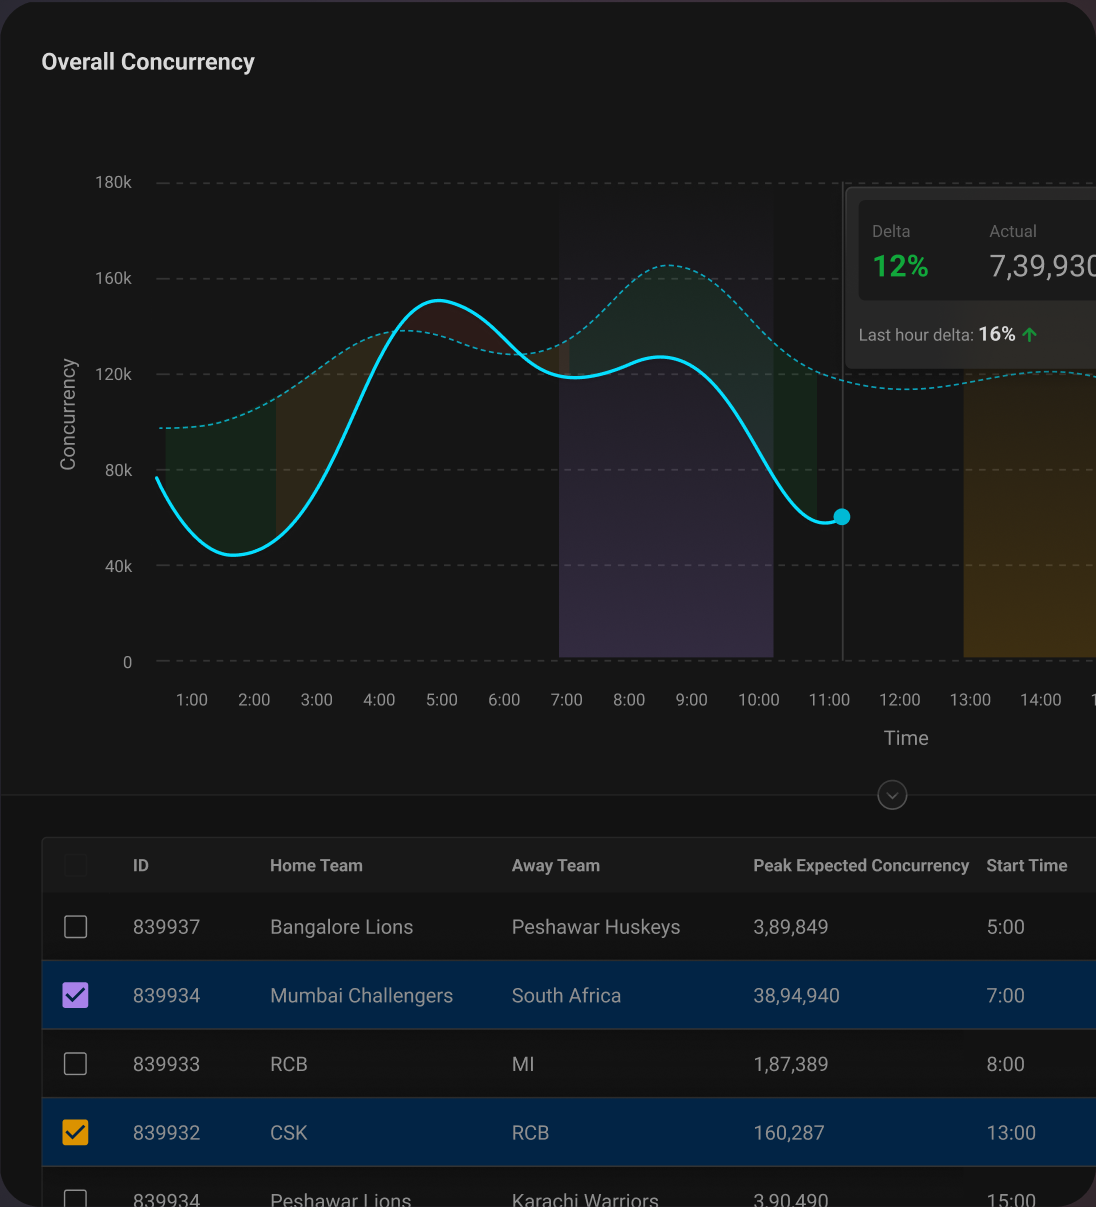
Concurrency Prediction
Users can quickly see what events are causing concurrency fluctuations
Under-Scaled Services
The watch commander can see a sorted list of services with the highest aggregate drift % (instances demanded vs supplied)
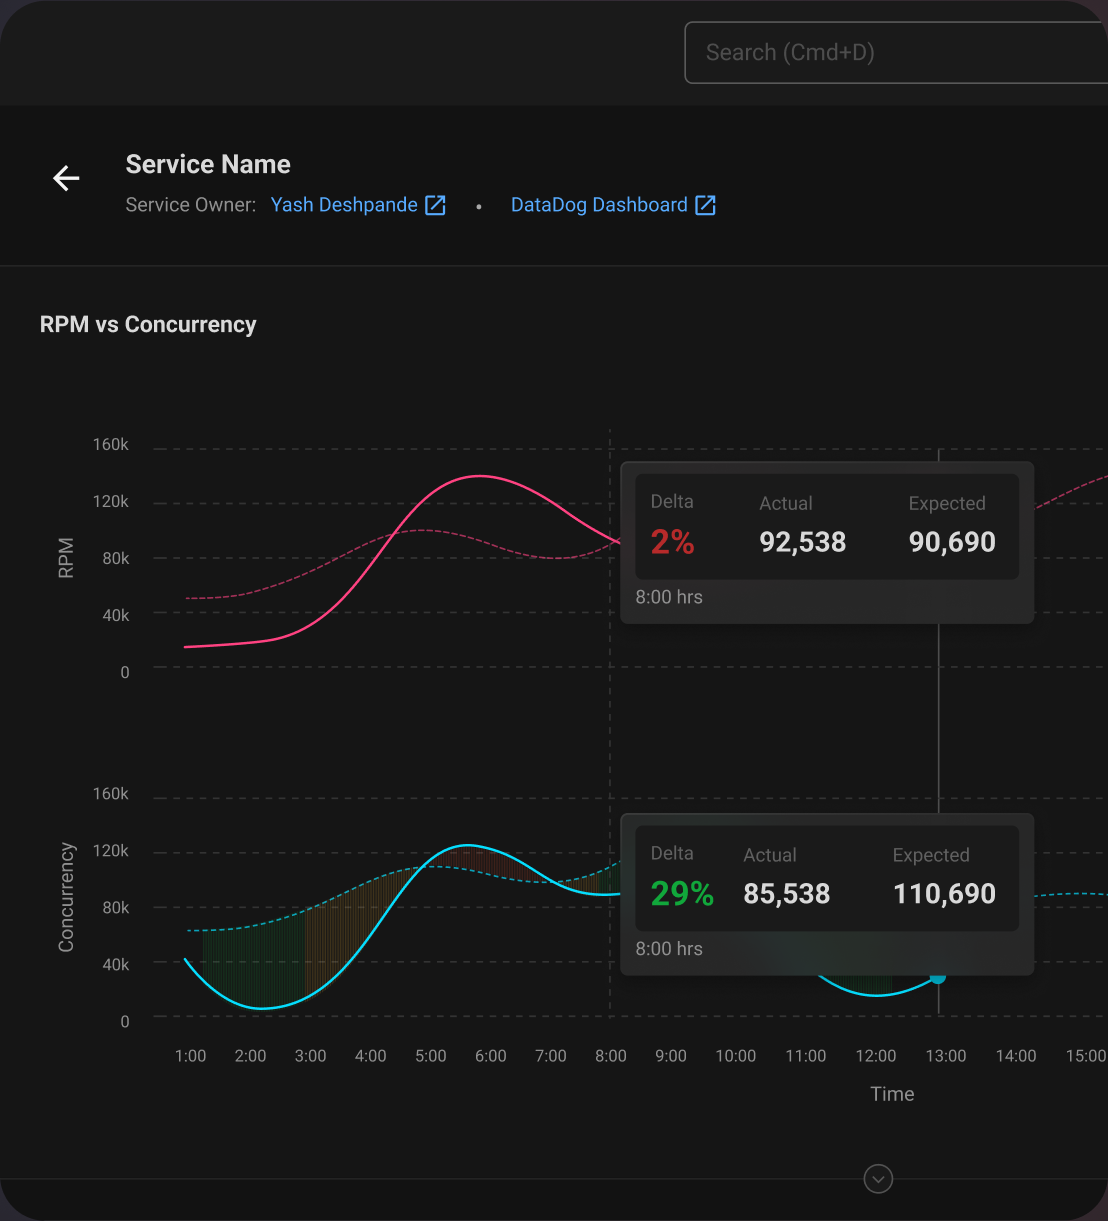
Concurrency & RPM
The Service Owner can observe the relation between Concurrency and RPM in real time or in retrospect.
TV Mode
Used to display concurrency vs prediction on office TVs, preventing reasonable buffer usage.
🕹️
Solving for Control
Making scaling easier and more engaging for the service owner
Customisation
Service Owners can define the Concurrency-RPM relation, manually, through a fixed ratio or using a data-based formula. This customisation minimises the need for manual scaling.

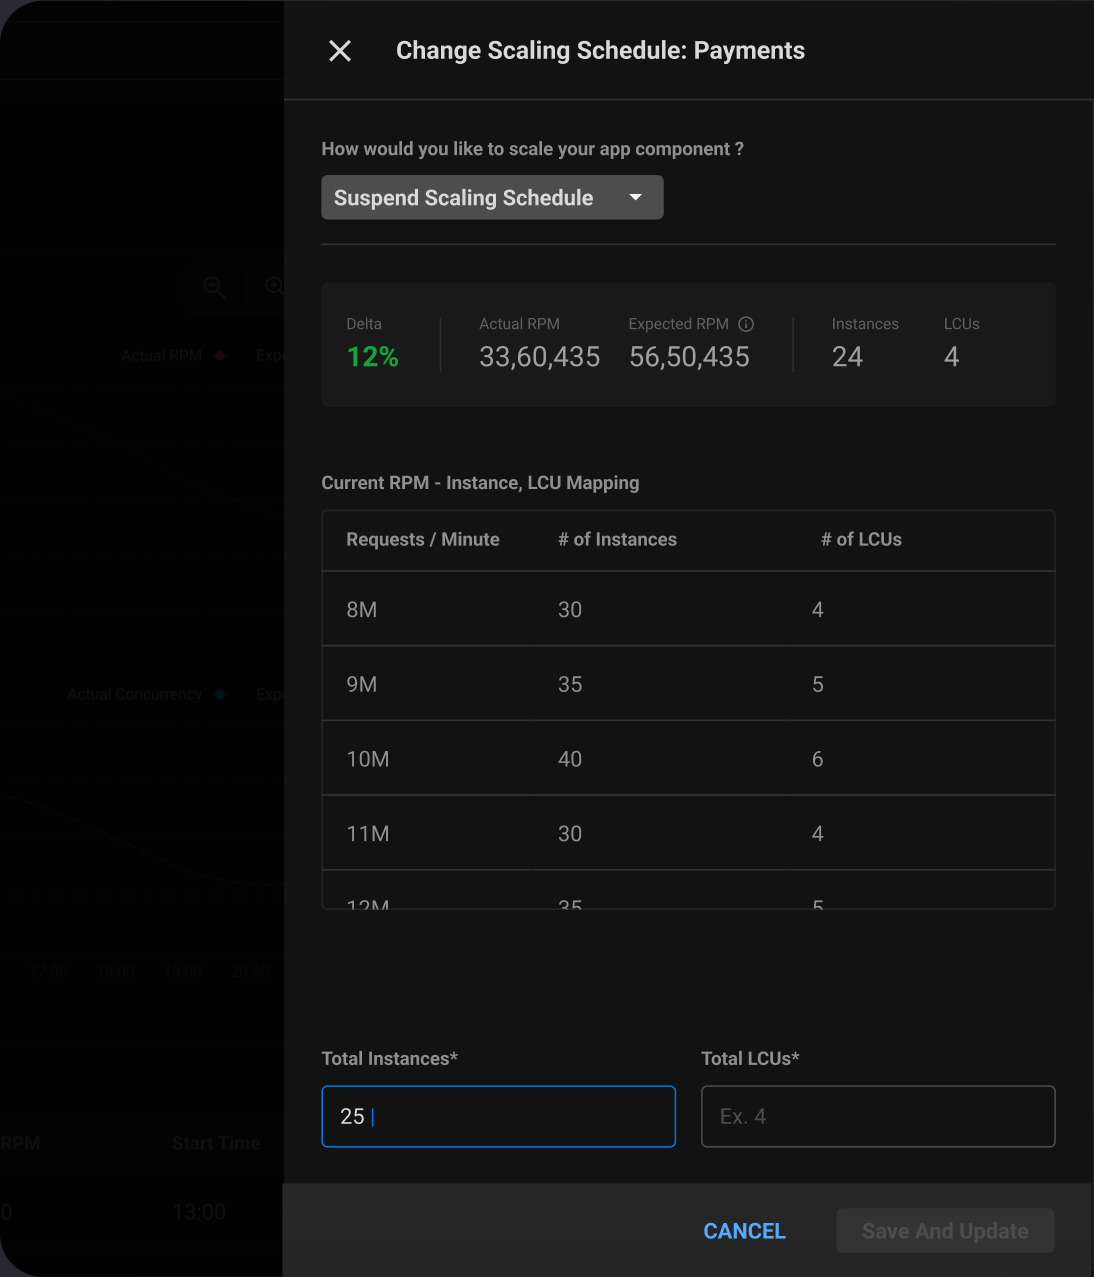
Set Scaling Schedule
The service owner can modify the scaling behaviour set by the system.

Take Manual Control
During downtime or maintenance, the service owner can choose to keep a minimum number of instances running.
😮💨
Solving for Effort
Making it easier for the service owner to define service behaviour
Autofill
Product assists manual entries in RPM to Instance mapping by suggesting linearly or exponentially extrapolated values based on historic data.
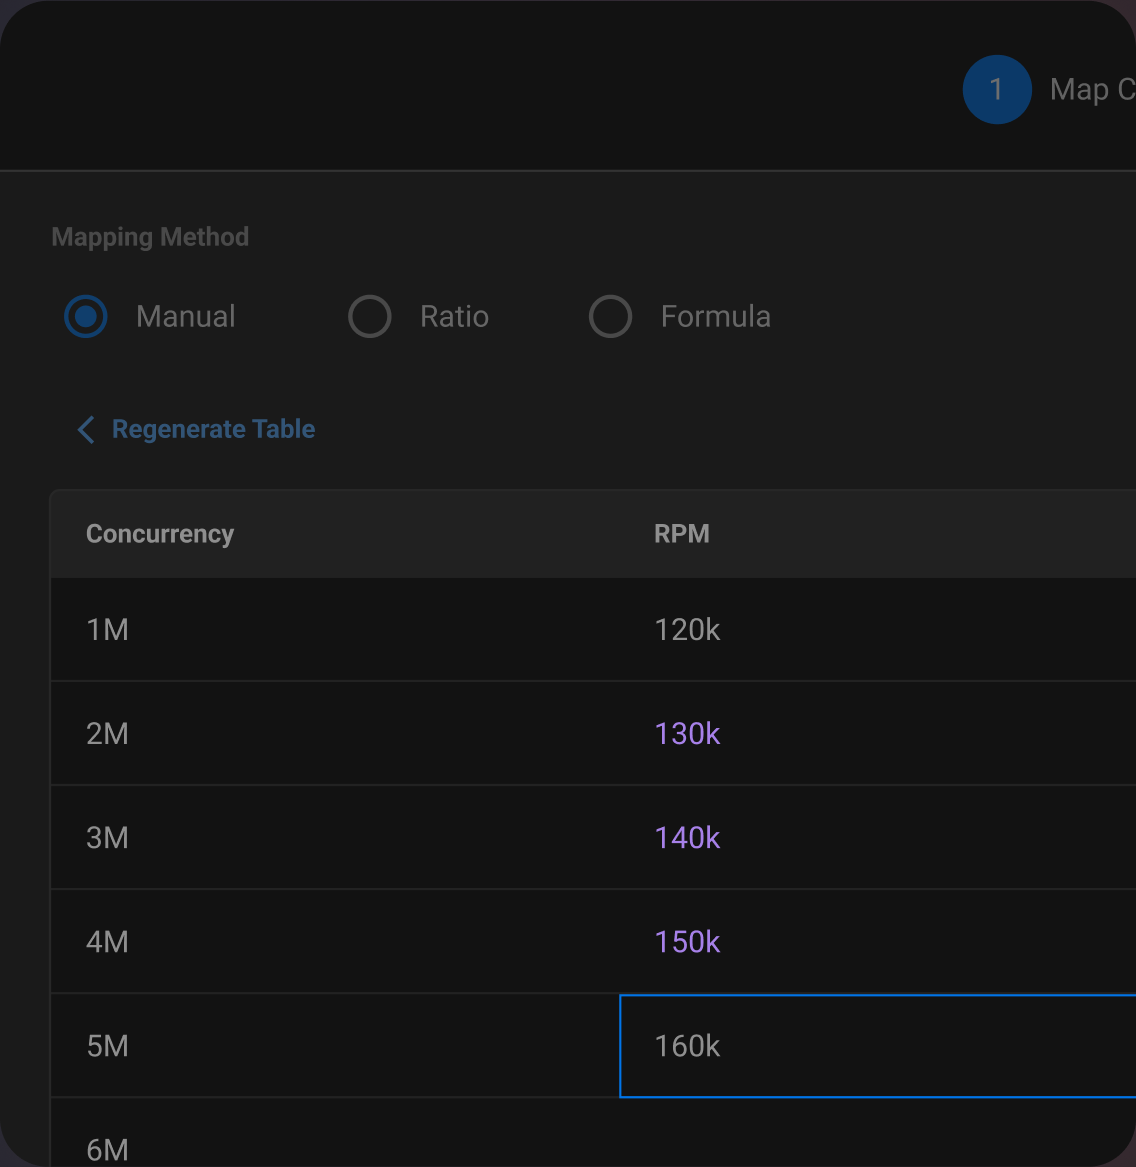
Making Mapping Engaging
Service Owners can set a reference against Max, P95, P80, or average values from historical data, and modify their curve using arrow keys. This provides an engaging and playful alternative to filling a mapping table.

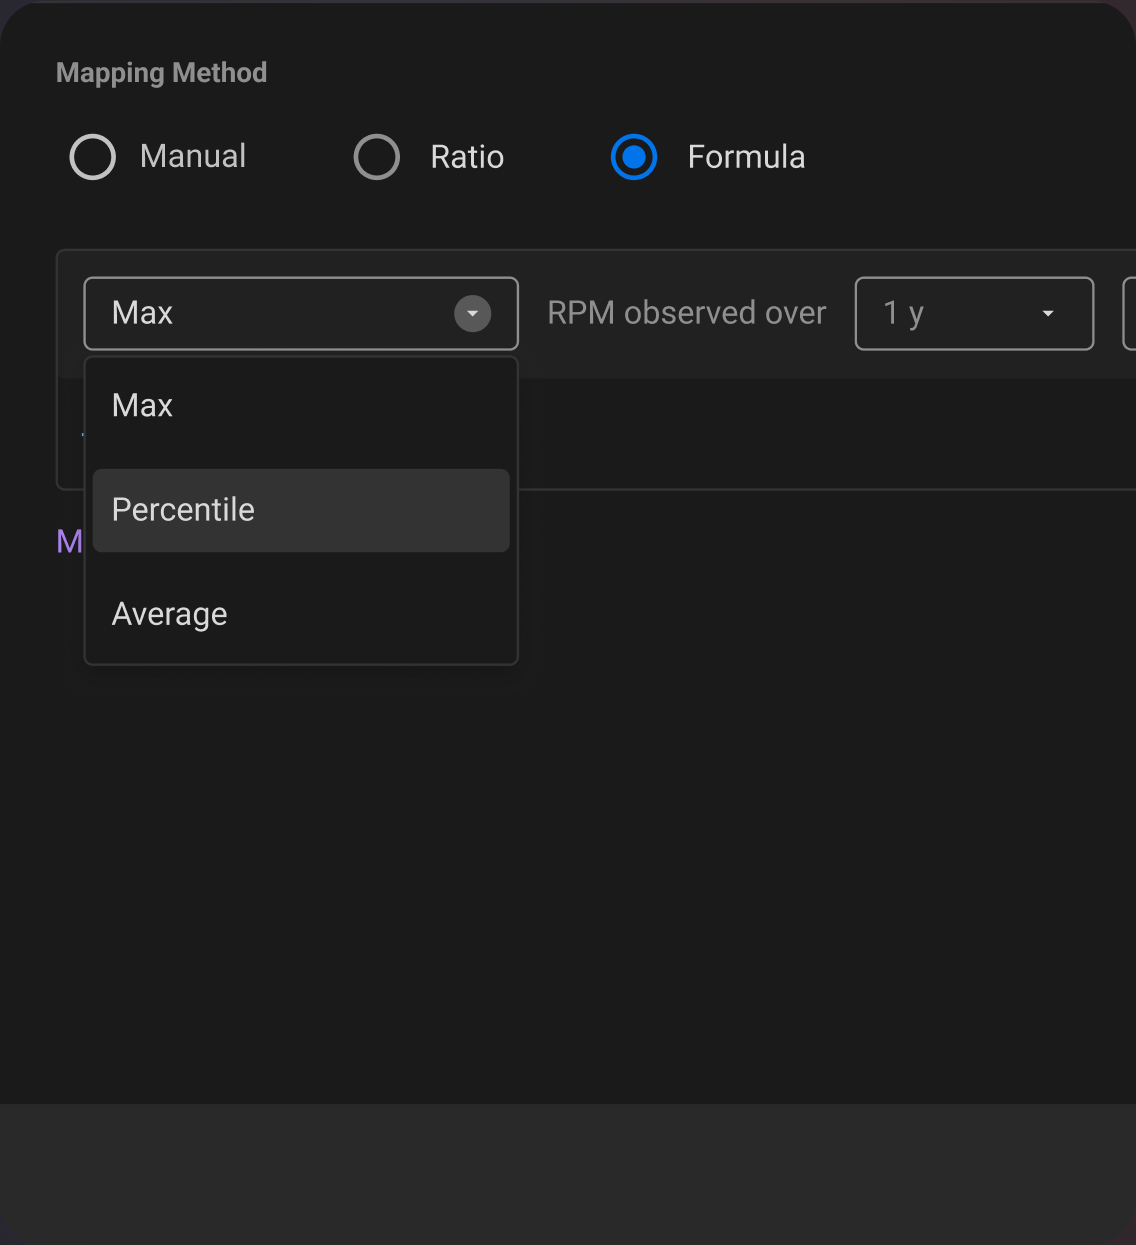
Formula based Mapping
The user can create a formula from historic values such as '50th Percentile RPM values over the last 6 months'. This significantly reduces effort and helps users rely on data.
🏆
Impact
What changed?
After 3 months of release